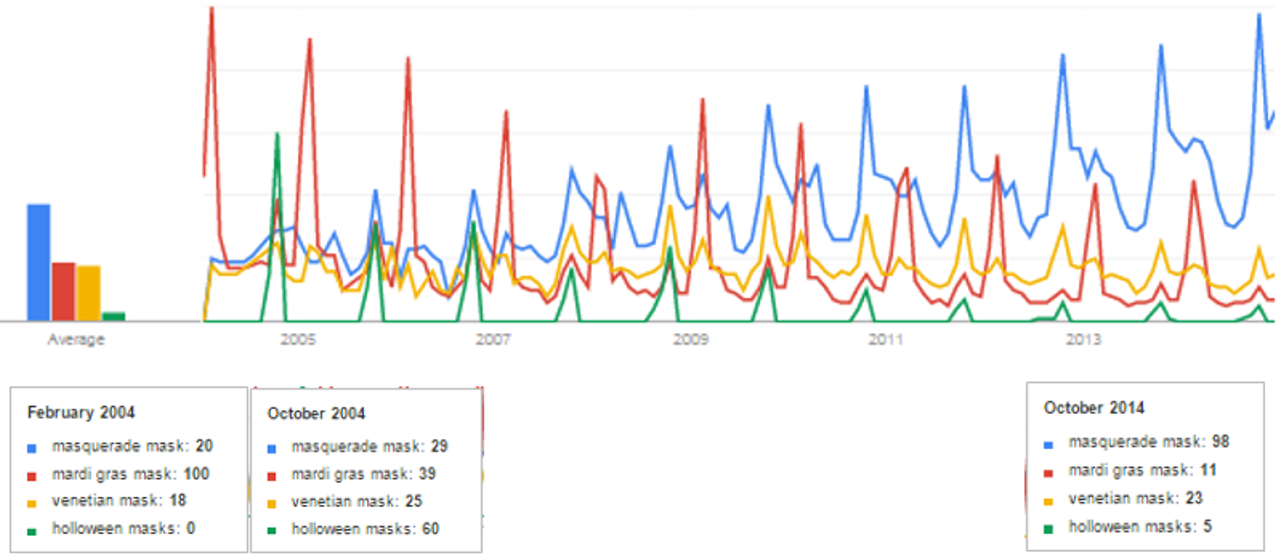
We had analyzed the interest in the categories of the Masquerade, Mardi Gras, Venetian and Halloween masks.
First, the chart shows the yearly search spikes coinciding with the Halloween (in October) and Mardi Gras (in February).
Second, the trend shows the maximum interest for fun with Halloween masks in 2004 and the categories’ trend to the present time. All of the Halloween fun was good, except for the burglaries at some stores over a number of years in a row, which was no fun at all. Fortunately, the burglaries seem to have been stopped by better store security in recent years.
Third, the fun with Halloween masks (indicating parties actually) had been steadily going down. Is this true? When answering the question we have to consider that the trend is based on Google Trends search data relative to all searches for an ever increasing diversification of interests and e-commerce growth; we may need some absolute masks sales, instead of just relative interest data. However, the venetian masks trend is kind of steady while the masquerade ball one goes up. So, the Halloween trend could be true, maybe just losing ground to the masquerade ball parties; the reason being that the former is …too scary?
What do you think? Is the interest in Halloween parties going down? Are they turning into masquerade ball parties organized at the same time? (See our video and blog on Masquerade Ball Legendary Parties).
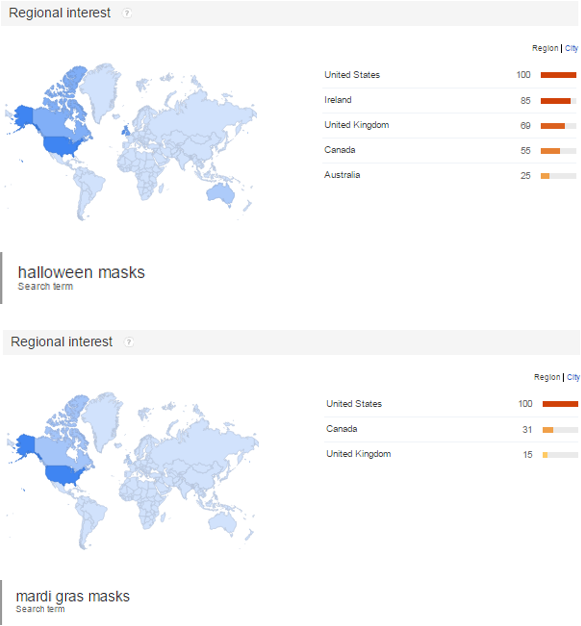
If we look at the interest in different countries, obviously US shows the top interest with Halloween and Mardi Gras because they are American traditions
(see Wikipedia for very interesting references on both).
.
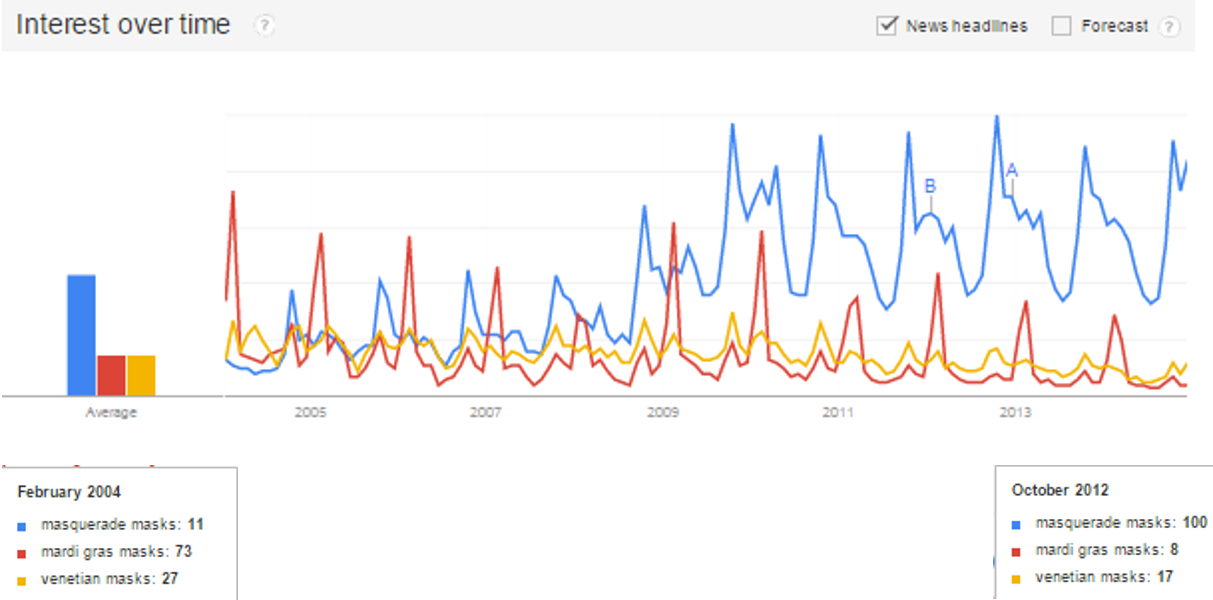
If we eliminate the Halloween masks from our analysis, we see a growing interest in the masquerade and a diminishing one in the Mardi Gras one.
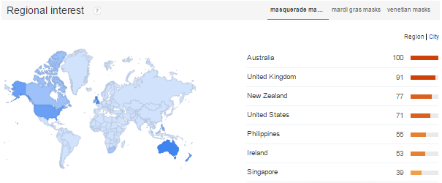
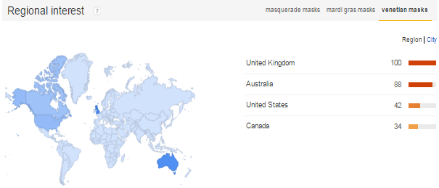
While happy to see the masquerade fun trend we wonder how can we help increasing the interest in Mardi Gras? We can’t ignore the music going along with it! Is “exporting” its fun to other US cities or other places in the world, while keeping New Orleans as the Mecca of it, possible? What do you think? Here is how the geographic distribution of interest looks like on these three categories. Let’s dive a bit into these data. Australians are on top with the masquerade, closely followed by the British people. British are on top with the Venetian masks…maybe because they’re closer and travel more to Venice than the Australians.
Google Trends collects both data searches and media headlines. If you check “News Headlines”, it’ll show a small letter of its publication and a link to the article. See the link below for a sample of such an article published in The Telegraph, UK and other articles in the US editorials.
   |